FlexQuery is the core module of Retail IQ’s ecosystem of applications built specifically with retailers in mind. FlexQuery provides the core functionality that empowers users to extract value from all of the data they collect in their SQL compliant databases. FlexQuery supports Retail Pro’s Oracle and MySQL database and works with Retail Pro 9 and Retail Pro Prism.
FlexQuery extracts data from SQL compliant databases and stores the data in in-memory tables. It then provides an extensive set of features that allow end users to make sense of and add meaning to the raw data they collect in their SQL compliant databases. FlexQuery’s core functionality includes grid layouts, pivots, charts, dynamic date ranges (e.g. today, yesterday), sorting, filtering, grouping, ranking, exporting to Excel, PDF, CSV, HTMLK, JSON, XML, and other formats. It also provides a spreadsheet function which allows direct editing of the data set within FlexQuery. This can then be exported and imported back into Retail Pro using FlexQuery DMA.
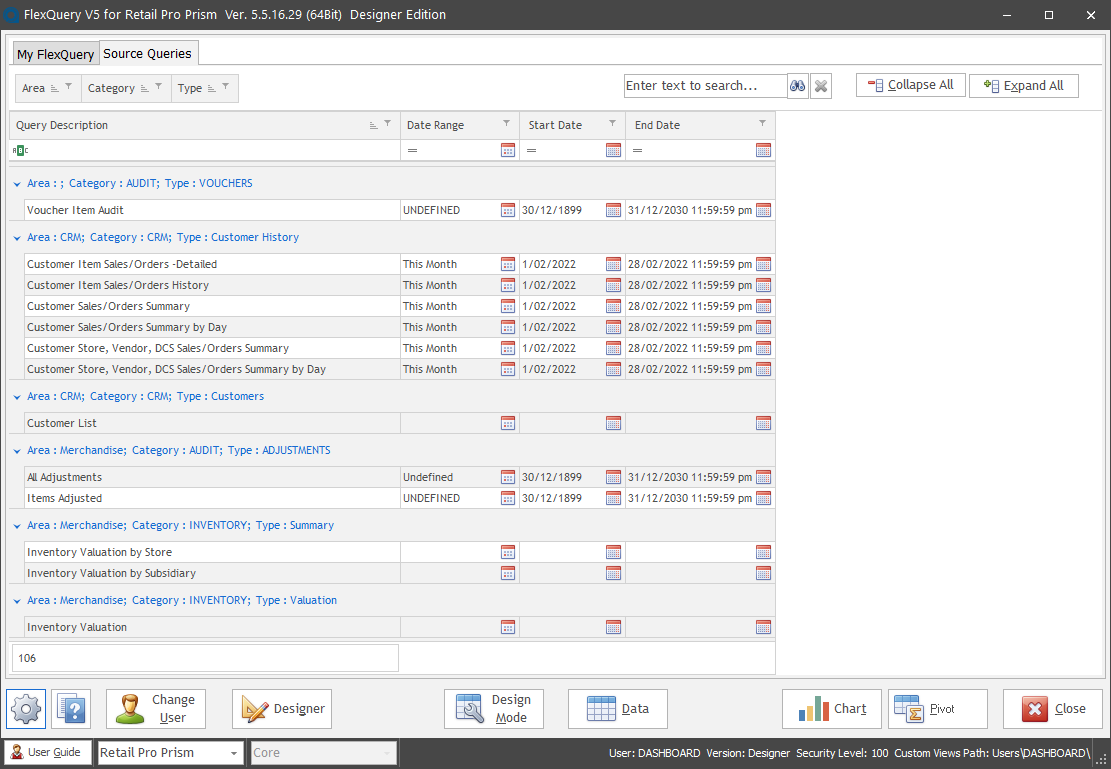
FlexQuery is bundled with 580+ SQL queries for Retail Pro 9 and over 100 SQL queries for Retail Pro Prism. By bundling these source queries we have taken the complexity out of reporting out of Retail Pro allowing the end user to focus on what data they want to see and how they want it displayed. Because FlexQuery loads the resulting dataset into memory it is possible to work with the data without needing to rerun the query. This allows for an unpresented level on analysis.
Features
- OLAP (On Line Analytical Processing) like functionality – through the use of Pivot Tables, give the ability to process, analyze and view data from many different viewpoints on screen instantly without having to generate multiple reports.
- Multi-Dimensional Database – A dimension is a slice of data. For example, FlexQuery can display values (dollars, units, percent, turn rate, etc.) by store, by vendor, by department – each of these is a data dimension. FlexQuery permits on-line analysis of an unlimited number of dimensions including store, region, day, month, quarter, year, vendor, department, class, style, size, color, season and many others.
- Drill Down – Being able to instantly break out any data dimension into more detail. The dimensions you access when you “drill down” are user definable and results are displayed immediately.
- Pivoting – The ability to switch the hierarchy of how you view data. For example, assume you are looking at the sales of each department from within a vendor or vendors. With a drag of the mouse you can pivot to see the sales of every vendor from within a department or departments. The combinations are almost infinite.
- Charting – Statistical data can be shown on graphs or exported to Excel.
- Data Export – Data can be exported in numerous formats, including XML, XLS/XLSX and PDF.
- Filtering – Dropdown lists of unique values in every column. Quick Filter in each column (allows ‘containing” as well as ‘beginning with’ or ‘Ending with’ filters). Simple 3 conditions filtering. Complex filter building. Filters can be saved for future use and can be applied at run-time.
- Powerful Search and Filtering Capabilities – Data can be filtered in a number of different ways, focusing in on the important things and temporarily hiding the unimportant. Filtering is available through dropdown lists of unique values in every column and each column allows for quick filters supporting ‘containing” as well as ‘beginning with’ or ‘ending with’ filter options. Complex filter building is also available with support for AND/OR operators which can also be nested. Filters can be saved for future use and can be applied at run-time.
- Ranking – Ranking can be done instantly by any value. Rank stores, vendors, departments, etc. by sales volume, turn rate, GMROI, profitability, days of supply or any other statistic. Rank and unrank instantly, best to worst or worst to best.
- Support for single site or large, multi-site enterprises.
- Access Control – Manage access and creation of reports from head office. For example, while a corporate office user can access enterprise-wide data for analysis, individual stores or branches can have varying, determined, limited access to specified data and reports.
- Unique design and extensive feature set – Allows for simple operation and data formatting in a manner that lowers the level of in-store skill required to operate the system.
- Easy to deploy and maintain – FlexQuery installs in a matter of minutes, and with over 580 source queries plus default layouts can be used out of the box. As FlexQuery accesses data from SQL databases in a read-only manner, FlexQuery requires no maintenance; it’s ability to deliver information from raw data is entirely dependent on the optimal functioning of the source database FlexQuery is communicating with.
FlexQuery is available in a Professional and Viewer+ edition – compare features. The Professional edition allows for the creation of Custom Views which can then be shared, while the Viewer+ edition provides a means for running custom views but without the ability to save changes. This ensures consistent reporting and analysis across departments, locations, and functions.
FlexQuery is licensed per PC it is installed on or by concurrent user when deployed on a terminal services or Citrix environment.